Digital photography has revolutionised how photographers capture and edit images, providing various benefits. The use of histograms is one of these advantages, as they offer a powerful tool in digital photography that provides a graphical representation of the tonal range in an image.
In this blog post, I want to share with you the significance of histograms and how they can be effectively utilised in Luminar Neo.

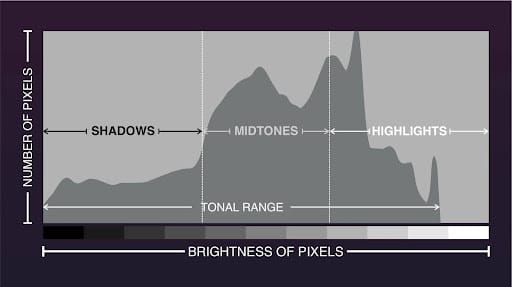
A histogram in photography is a visual representation of the distribution of tones in an image. It shows the brightness of pixels in a photograph, ranging from black on the left to white on the right, with different shades of gray in between.
The horizontal axis represents the range of brightness values from 0 (black) to 255 (white), while the vertical axis shows the number of pixels at each brightness level.
Experience the world of photo editing AI with Luminar and get $10 USD OFF 12 and 24-month plans when you enter the promo code ‘iPhotography’.
Histograms are helpful tools for photographers as they provide valuable information about the exposure of an image. Here are some key points that explain what histograms are used for:
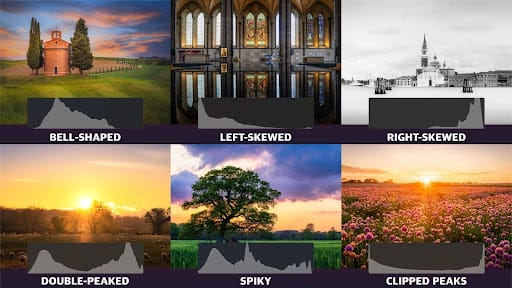
Histograms can help to determine the exposure of an image. The graph may be skewed to the left, indicating that the photo is underexposed (too dark), while a histogram skewed to the right suggests overexposure (too bright).
The shape of the histogram can also provide insights into the contrast and dynamic range of the photo. A narrow histogram indicates low contrast, while a wide histogram with peaks and valleys suggests higher contrast.
Examining the histogram can identify whether your image has lost detail in the highlights (right side) or shadows (left side). Clipped or “blown-out” highlights and shadows may result in losing essential information, and the histogram helps avoid such issues.
The RGB histogram provides colour distribution in photos, useful for adjusting Saturation, White Balance or HSL Panel.


Understanding the shapes of histograms can provide valuable information about a photograph’s exposure and tonal distribution. Here are some typical shapes of histograms and their explanations:
When it comes to image processing, a histogram is a valuable tool that can be used in post-processing and during the initial image capture. While reviewing images on a camera’s LCD screen is a common practice among photographers, it is only sometimes reliable since the brightness levels of different screens can vary.
In bright environments, it can be challenging to read the screen correctly. Histograms, however, provide a more accurate representation of an image’s exposure by displaying a graph of the distribution of tonal values.
They enable you to determine if your photo is overexposed, underexposed, lacking contrast, and more — thus making your post-processing workflow more efficient and effective.
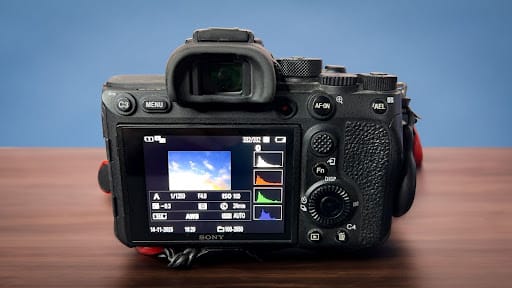
It’s important to note that not all cameras display their histograms automatically. However, if your camera has a live view, you can usually access the real-time histogram by pressing the “Info” button (or equivalent) a few times.
To view the histogram for an image you just created, display the image and press the “Info” button (or equivalent) again. If you cannot locate the histogram, refer to your camera’s manual for further guidance.
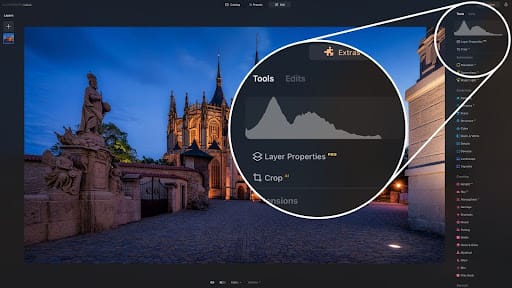
Histograms are an essential tool in Luminar Neo for adjusting exposure, brightness, contrast and color balance. They are handy when fine-tuning an image to ensure that all its details are preserved.
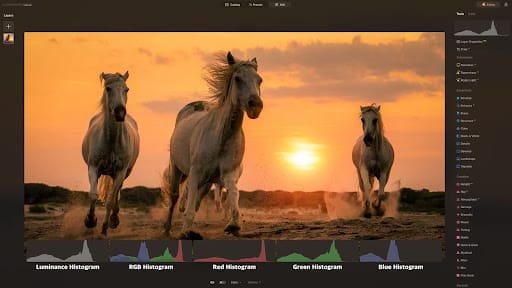
To access the histogram in the Edit module, navigate to the top of the main toolbar. If it’s not visible, right-click on the image and select “Show Histogram.” Click the histogram to choose between Luminance, RGB, and Red, Blue or Green views. Once at the Histogram, you can activate the live clipping mask by clicking on one of the two white circles in the top corner.
In addition to this, you can view a larger version of the luminance and separate color histograms in the Curves tab of the Develop and Develop RAW tool.
Luminar Neo’s histograms come in various types, each providing specific information about the distribution of tones in an image. They serve as visual guides, offering insights into exposure, colour balance and tonal distribution, enabling photographers to create well-balanced and visually appealing photos.
The most common type of histogram that displays an image’s brightness or luminance values. The x-axis ranges from black to white, showing the distribution of tones from shadows to highlights. Peaks and shifts in the luminance histogram provide insights into the exposure and tonal range of the image.
The RGB histogram displays the distribution of tones for each of the three primary colour channels: red, green and blue. It helps photographers analyse the image’s colour balance, saturation and overall colour distribution.
Luminar Neo offers not just an RGB histogram but also separate histograms for each colour channel, namely Red, Green and Blue. These histograms are helpful for photographers in making precise colour adjustments by detecting colour imbalances and ensuring that each channel contributes proportionately to the overall colour composition.
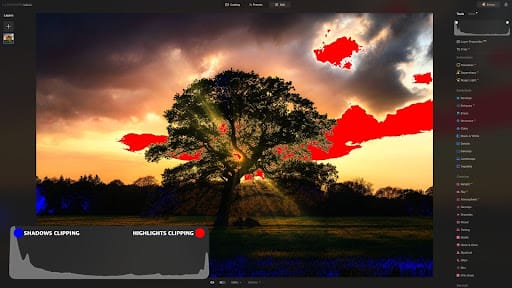
In the Edit module, photographers can use a visual tool called a clipping mask to spot areas in an image where highlights or shadows are being clipped. This happens when an image is overexposed or underexposed, causing essential details to be lost. The clipping mask shows these areas as blue (for shadows) or red (for highlights), making it easier for users to identify and fix potential issues in their photographs.
Press the “J” key on your keyboard to activate the clipping mask. You can activate both the highlights and shadows clipping masks or trigger them separately by clicking on one of the white circles on the histogram.
Once activated, the live clipping mask will display the clipped areas as overlays in blue or red. The clipping mask will adjust in real time as you edit the image using any available tool in the Edit module.
Once you have created a clipping mask, you can easily adjust both highlight and shadow clippings using the Develop (Develop RAW) tool. For the highlight clipping, move the “Highlights” slider to the left for the highlight clipping to recover the details.
If this doesn’t work, try adjusting both the “Exposure” and “Whites” sliders. To fix the shadow clipping, use the same technique but with the “Shadows” and “Blacks” sliders. You can fine-tune the result by adjusting the Tone Curve in the Curve tab.
In Luminar Neo, there are several ways to utilise histograms during post-processing. Your chosen methods will depend on your photography style, personal workflow, and desired results. As a starting point, we recommend following the traditional workflow based on the earlier sections of this blog post.
1. Launch Luminar Neo and select the image you want to edit. Once you have done this, navigate to the “Edit” module and activate the histogram and clipping mask in the main toolbar. Review the information on the Luminance histogram and look for possible clipping on your image using the live clipping mask.
2. To adjust your image, open the Develop tool in the Essentials section of the main toolbar. Here, you can adjust the overall exposure of the image with the “Exposure” slider. The amount and direction of the adjustment will depend on the general shift of the histogram. You can also reduce as much clipping as possible with the “Highlights,” “Shadows,” “Blacks” and “Whites” sliders.
3. Depending on the shape of the histogram, use the “Contrast” slider to stretch or compress the tonal range in your image by pushing pixels towards the extremes of black and white or closer to the mid-tones.
4. If necessary, you can adjust the white balance of your image. To do this, switch your histogram to RGB type by clicking on the actual histogram. Review the distribution of the colour tones in your photo and use the “Temperature” and “Tint” sliders in the Colour tab to adjust it.
5. For more precise control over the luminance and colour adjustment, use the curves in the Curve tab.
Histograms have become an essential tool in digital photography, especially in platforms such as Luminar Neo.
These graphical representations of tonal distribution not only evaluate exposure, but also guide adjustments for contrast, dynamic range and colour balance. By understanding the various shapes of histograms, photographers can decode the nuances of their images.
Luminar Neo integrates histograms seamlessly into its user-friendly interface, providing several histogram types for precise insights. By embracing these tools, photographers can unlock their images’ full potential and reveal their beauty in every pixel.
Experience the world of photo editing AI with Luminar and get $10 USD OFF 12 and 24-month plans when you enter the promo code ‘iPhotography’.
(iPhotography may make small commissions from links in this article.)
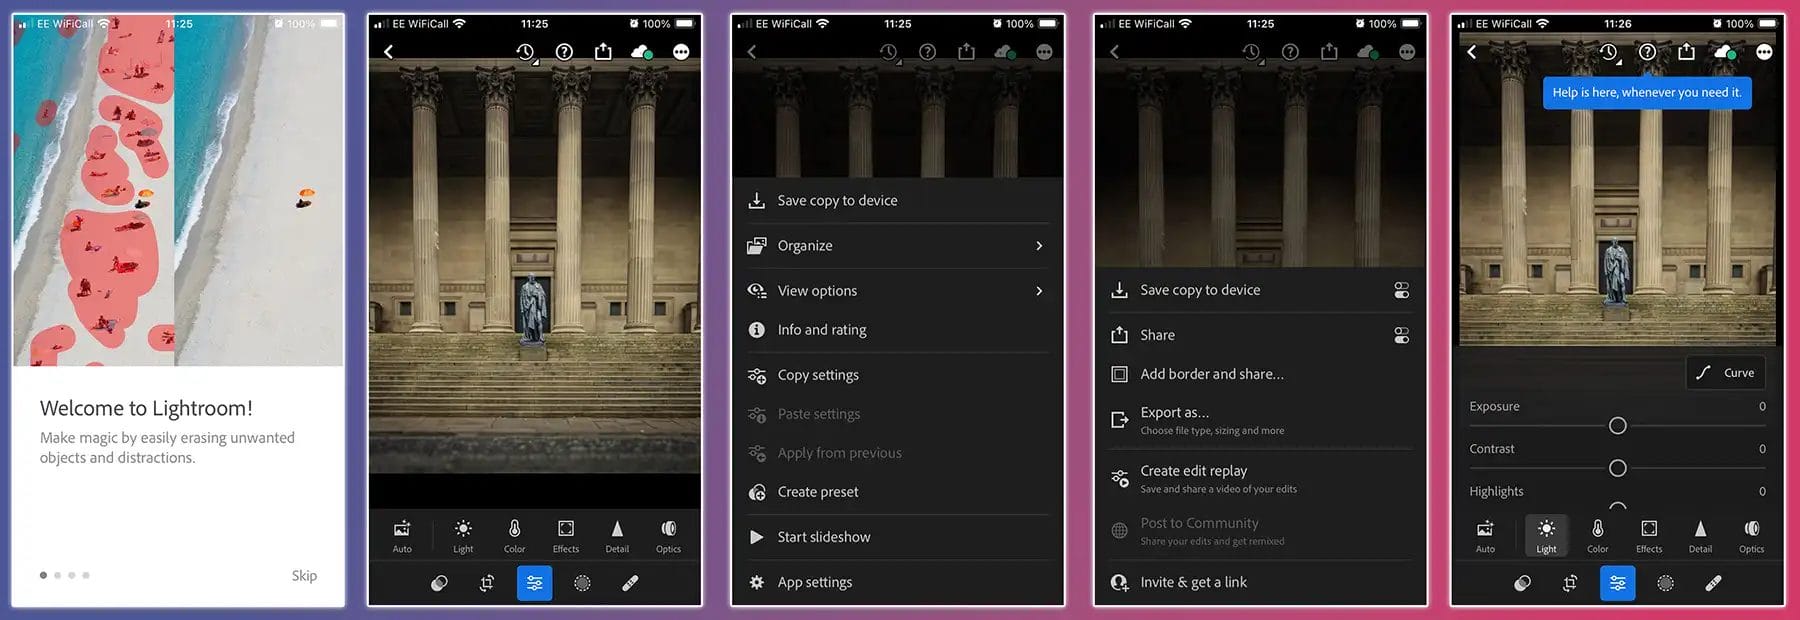
Discover TOP features in the Lightroom CC mobile app with this guide for enhancing your photo editing skills. For desktop and tablet too.
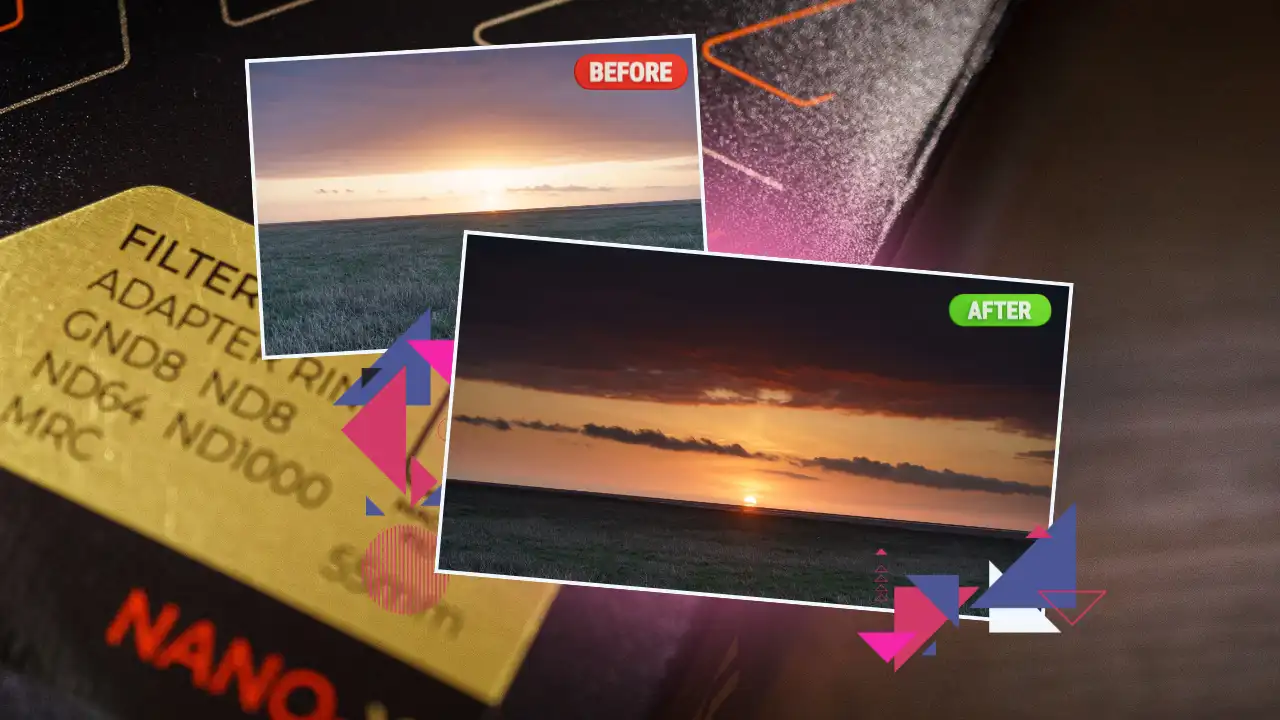
Shooting sunsets using amazing 5-in-1 magnetic lens filters from Kentfaith, the 1st choice for photo & video products.
Popular memory cards for photography – what’s the best SD card for your digital camera? Choose the right capacity and class speed in our guide
Learn the basics of photography – fast – with our FREE 60-Second Photographer online course. Each class is short and sharp with simple, actionable steps that give you immediate results.
x 30 lessons
© iPhotography™
Become a confident and competent photographer in less than 30 minutes!
Before you leave, make sure you’ve secured your FREE online photography course (worth £29.99)
Each class is just 60-seconds or less making it the fastest and easiest way to learn photography!
